Most Runs by Australia in ODIs: Ricky Ponting scored 13,704 ODI Runs, Michael Bevan scored 6,912 at an Average of 53.58
Last Updated:
In 375 matches between 1995 and 2012, Ricky Ponting had 13,704 ODI runs in Australia. He hit 30 centuries. No other Australian has scored 10,000 ODI runs. In this list, there will be over 4,000 run differences between the first and the second.
In 232 ODIs, Michael Bevan had a score of 6,912 runs with an average of 53.58. He is the seventh highest run scorer of Australia in the format with David Warner and Matthew Hayden on the other end. He has 6 centuries. He is also the greatest finisher Australian ODI cricketing has ever had. The sum and the mean say altogether different things about his value.
This table presents career ODI runs of Australia. What it fails to show is when such runs were made, what circumstances generated them and why the 6,912 runs of one batter made more difference than the 8,500 of another.
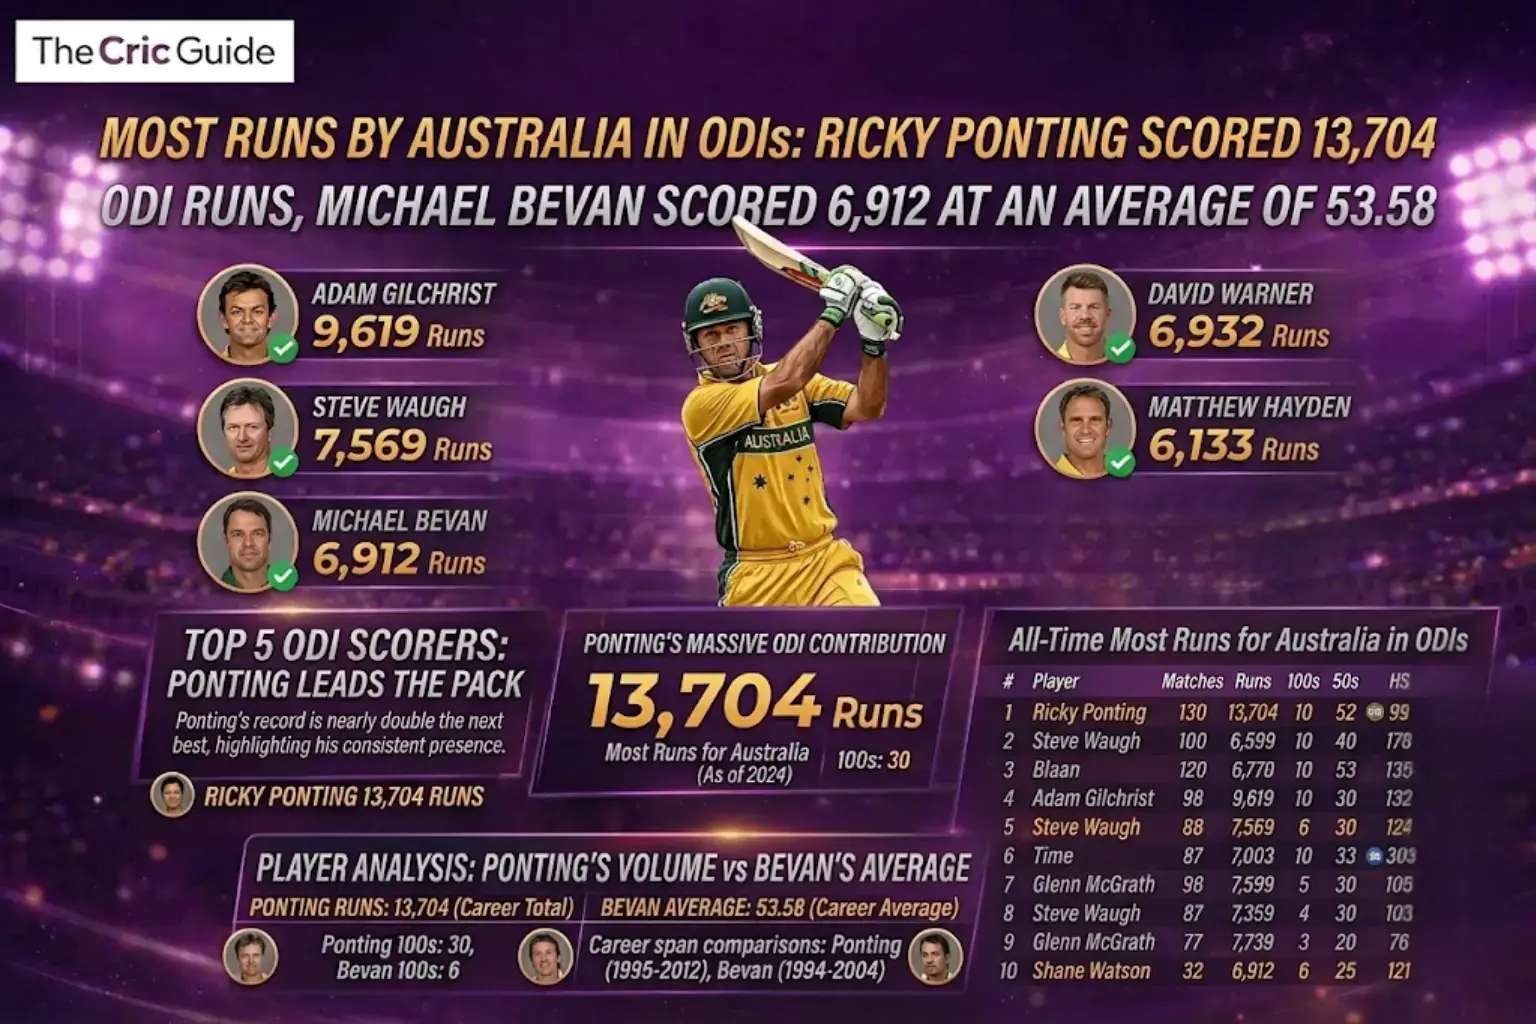
All-Time Most Runs for Australia in ODIs
| No. | Player | Matches | Innings | Runs | Average | SR | 100s | 50s | HS | Era Active |
| 1 | Ricky Ponting | 375 | 365 | 13,704 | 42.03 | 80.4 | 30 | 82 | 164 | 1995–2012 |
| 2 | Adam Gilchrist | 287 | 279 | 9,619 | 35.89 | 96.9 | 16 | 55 | 172 | 1996–2008 |
| 3 | Mark Waugh | 244 | 236 | 8,500 | 39.35 | 76.9 | 18 | 50 | 173 | 1988–2002 |
| 4 | Michael Clarke | 245 | 223 | 7,981 | 44.58 | 78.1 | 8 | 58 | 130 | 2003–2015 |
| 5 | Steve Waugh | 325 | 288 | 7,569 | 32.9 | 75.1 | 3 | 45 | 120* | 1985–2002 |
| 6 | David Warner | 161 | 157 | 6,932 | 45.3 | 95.8 | 22 | 36 | 179 | 2009–2023 |
| 7 | Michael Bevan | 232 | 196 | 6,912 | 53.58 | 74.2 | 6 | 46 | 108* | 1994–2004 |
| 8 | Matthew Hayden | 161 | 154 | 6,133 | 43.81 | 79.4 | 10 | 36 | 181* | 1993–2008 |
| 9 | Dean Jones | 164 | 161 | 6,068 | 44.62 | 72.4 | 7 | 46 | 145 | 1984–1994 |
| 10 | Shane Watson | 190 | 178 | 5,757 | 40.54 | 86 | 9 | 37 | 185* | 2002–2016 |
4 Things This Table Does Not Tell You
The highest ODI average of any Australian on this list is that of Michael Bevan with 53.58 which is over 8 runs above the next highest. He was hitting 5 or 6, was frequently summoned in the strife, and, in consequence, left the crease not less than other men of his grade. His 6 centuries are the least among the top 10.
One of the highest not-out in the history of ODIs is that of Bevan. He had been beaten 67 times in 196 innings, swelling his average, but also indicating that he was completing games, and not being dismissed, far more often on behalf of Australia. He was to win games, not to make totals. The 6 centuries indicate how infrequently was he in a position when it was necessary to the team to make a big score by batting. When there was a need to take out 30 out of 20 balls he came in and when it was taken out he went away. The mean is the right measure of his worth. The centuries is not its sum.
Steve Waugh had 7,569 runs in 325 ODIs with an average of 32.90. He is the sole player in the top 10 in Australia who has an average of less than 38. He has played more than anyone except Ponting and his average is the lowest in the group by almost 3 runs.
Waugh has played 325 ODs, the second most ever played by an Australian. His average of 32.90 is 9 runs below Ponting’s, 12 below Clarke’s, and more than 20 below Bevan’s. His service to Australian ODI cricket over 17 years was not mainly statistical in nature. He was a match-reader, a pressure absorber, and a team culture changing captain. He also played in the middle order at a time when the middle order was supposed to stick together and not to rush. The current ODI would have definitely yielded better figures on the part of the same player. His 3 centuries in 288 innings are certainly the lowest century rate in the top 10 in Australia.
David Warner had an average of 45.30 and a strike rate of 95.8 with 6,932 ODI runs in only 161 matches. He is ranked number six on the all-time list in Australia, even though he has only played 214 less games than Ponting. He has the highest strike rate in the top 10 with almost 9 runs per 100 balls.
Warner has a strike rate of 95.8 to the 80.4 made by Ponting, 78.1 made by Clarke and 74.2 made by Bevan. He was the fastest in this top 10 by far. The 22 centuries of his 161 matches makes his century per innings ratio only equaled by Ponting (30 in 365). This ball-tampering incident also led to a one-year international ban on what was termed as ball-tampering on Warner between 2018 and 2019. Had he been able to play normally during that time his career total would be in the 7,500 or 7,800 range. He had the most prolific run accumulator in Australian ODI history; he retired his ODI career in 2023.
Dean Jones scored 6,068 ODI runs in 164 matches from 1984 to 1994 at an average of 44.62. He batted in a time when 300-run totals were not a regular occurrence in an ODI and when field restrictions were not routinely abused. His batting average of 72.4 is not as high as today. By the standards of his time it was aggressive.
Jones debuted in ODI in 1984, eleven years before the introduction of the modern rules of powerplay. A competitive standard of ODI cricket in the mid-1980s was 4 to 5 runs per over. The 1988 strike rate of 72.4 was categorically different to that of 2024 of 72.4. Jones made 7 centuries and 46 half-centuries in a game that had much less strategic clarity than to how to attack and when to build. He is ranked number 9 on the all-time ODI runs list in Australia although he retired 30 years ago. He is the only Australian since Matthew Hayden who has taken him out of the top 10.
Ricky Ponting's 30 ODI Centuries. No Other Australian Has More Than 22.
Between 1995 and 2012, Ricky Ponting was the first cricketer to make 30 centuries in ODI cricket in Australia. David Warner has the second-highest score of an Australian of 22. There is a distance of 8 centuries. Adam Gilchrist comes third behind him with 16 and Mark Waugh with 18.
The centuries of Ponting were in 365, that is one in every 12.2. Warner worked 22 innings out of 157 inning i.e. one in 7.1 innings. In per-innings tally, there was almost twice the probability that Warner would make a century compared to Ponting. The total of Ponting is based on the volume and consistency over 17 years. Warner is built upon the frequency of attack and concentration of attack.
Ponting makes a record highest score of 164 in ODIs against South Africa in 2002. His 30th century was accomplished in his 346th innings, in 2012, when he ended his international career. His best innings in the record are his century in the 2003 world cup final against India (140 not out off 121 balls). It was on the most high profile stage, the most high profile match, and on his most high powers.
13,704 runs. 30 centuries. 375 matches. Ponting created the record no Australian will strike in the coming decade.
Best Australian ODI Run Scorer by Season: Past 5 Years.
| Season | Top Run Scorer | Runs | Innings | Average | 100s | Notable |
| 2023 | David Warner | 1,001 | 23 | 48 | 4 | World Cup: 535 runs in 10 innings |
| 2022 | Steve Smith | 854 | 20 | 49 | 2 | Surpassed 6,000 ODI career runs |
| 2021 | Aaron Finch | 647 | 16 | 46 | 2 | Back from injury, captaining again |
| 2020 | Steve Smith | 382 | 9 | 55 | 2 | COVID-reduced schedule |
| 2019 | David Warner | 833 | 18 | 52 | 3 | Returned from ball-tampering ban |
David Warner was the highest Australian-scorer in the 2023 world cup and the Australian leader in run scoring in ODIs with 535 in 10 innings and 4 centuries. He announced his retirement in late 2023, after the win of Australia in the world cup. The most prolific ODI scorer in Australia (not during the years of the World Cup) around the beginning of the 2020s when the format began to be marginalized in the Australian cricket calendar was Steve Smith, with more than 7,000 career ODI runs.
The decline in ODI matches around the world since 2022 indicates a lesser amount of chance to accumulate career totals. The most probable players who could be on the top 10 list in the coming 10 years are Travis Head, Marnus Labuschagne and Joshua Inglis, the three have not yet played enough matches to pose a threat anywhere in the top 10 list, not even in the top 5. Head has a strike rate of more than 100 and an average of over 50, however, with just 80-plus ODI games on his record he has a long way to go before he can match the total of Dean Jones.
Will Ponting's Record of 13,704 Ever Be Beaten?
None of the current Australian batters have been anywhere below 8,000 runs of the record set by Ponting. Steve Smith is a 6500-plus ODI-run player who is nearing his retirement. David Warner ended with 6,932. The next-generation candidate with the highest likelihood is Travis Head, but at his current rate he would require 250 further ODI innings – about 15 years more of heavy ODI action – to do it.
The challenge in the structure is ODIs are no longer played as often as it was at the time Ponting was at his prime between 1999 and 2007. Some of the seasons of that period saw Australia play 40 or more ODIs each year. The present schedule yields 25 to 30. Less matches translate to less accumulation. Even a batter who began his/her ODI career today would require more years to accomplish the same number of innings that Ponting had at the age of 35.
Playing time is also a T20 competition. Ponting never had to decide between the two formats and played no T20 internationals until late in his career. T20I, ODI and Test commitments of modern batters are managed in a more condensed international timetable. The format time that an Australian ODI batter will get in 2026 is significantly less than in 2003.
13,704 runs across 375 matches. It was constructed during 17 years when the format that had the greatest impact was ODIs. That era is gone. The record stays.
Related Pages
- Most runs in ODI World Cup history
- Most ODI wins by Australia all time
- Highest individual score in ODI World Cup
- Most ODI centuries all time
- Most finals played in ODI World Cup